Orange County 2025 Half Year Housing Market Update

I have been seeing headlines about how inventory is rising. This is true, even for Orange County. Active listings for residential homes for June 2025 in Orange County was at 5,903 and in June of 2024 it was at 4,398. That is a 34% increase year of year. It is also down 34% from from 8,922 homes in June of 2019 and down 24% from 7,725 homes in June of 2018.
The recent uptick in active inventory is not due to a flood of new listings. Instead, what we’re seeing is a combination of longer days on market, an increase in expired listings, and a decline in new homes hitting the market. This tells me that today’s buyers are becoming more selective, taking their time before making a move — and that’s slowing down the pace of sales. At the same time, many sellers who don’t need to sell are choosing to withdraw their homes from the market rather than negotiate. Add in the drop in new listings, and it’s clear that the current rise in inventory is more of a temporary accumulation, not a signal of oversupply. Looking ahead, unless there’s a sudden surge in new listings, inventory is unlikely to spike significantly from here.
Some buyers are sitting on the sidelines, hoping prices will suddenly fall and hand them the deal of a lifetime. But that’s not how this market is shaping up. Waiting too long may actually cost you more, especially if interest rates dip and competition heats back up. Focusing on negotiating a good deal now would be the smarter strategy — it won’t take much of a drop in interest rates to reignite demand and bring multiple-offer scenarios back in full force.
New Listings Plummet While Prices Stay Elevated
San Clemente Real Estate
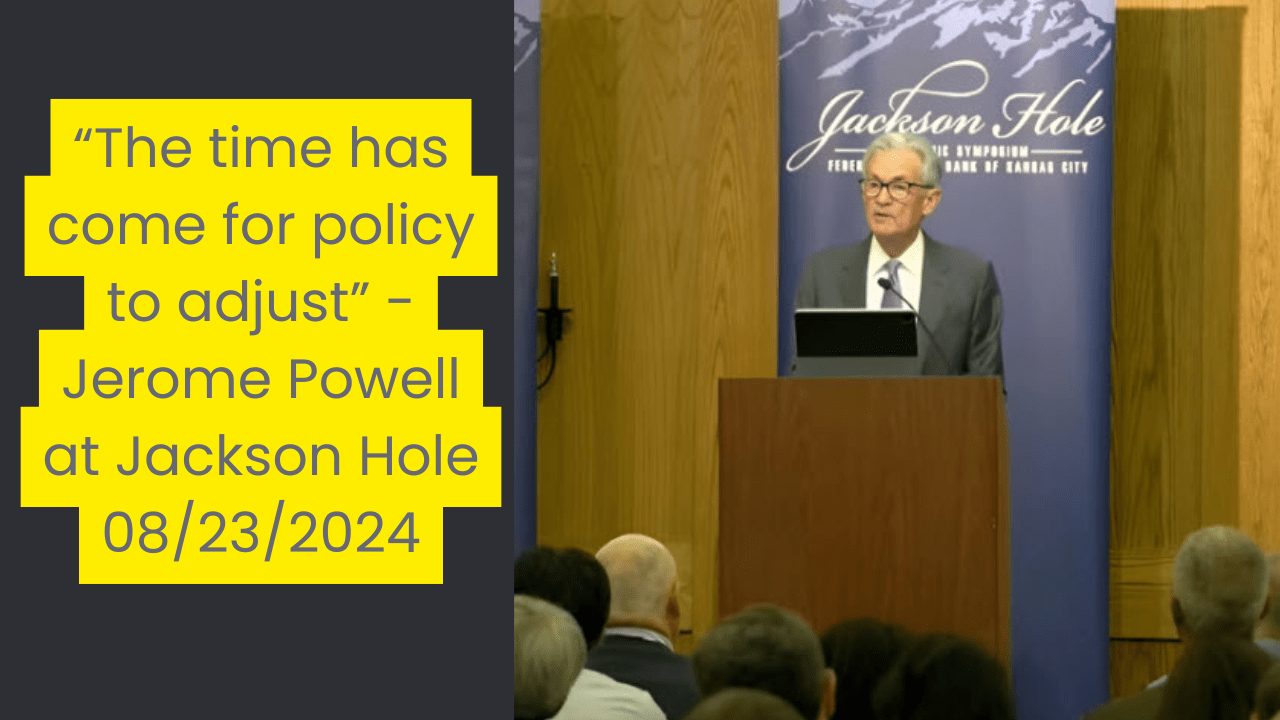
Fed Reserve and Orange County Housing Market Update
The attention to detail required of an appraiser has been applied to the entire buying or selling process. From listing properties and researching home values to arranging the necessary paperwork, Mat assures his clients that the tiniest of details won't fall through the cracks. Contact him today to discuss all your real estate needs.


