 SAN CLEMENTE ACTIVE LISTINGS OVER THE PAST 4 YEARS
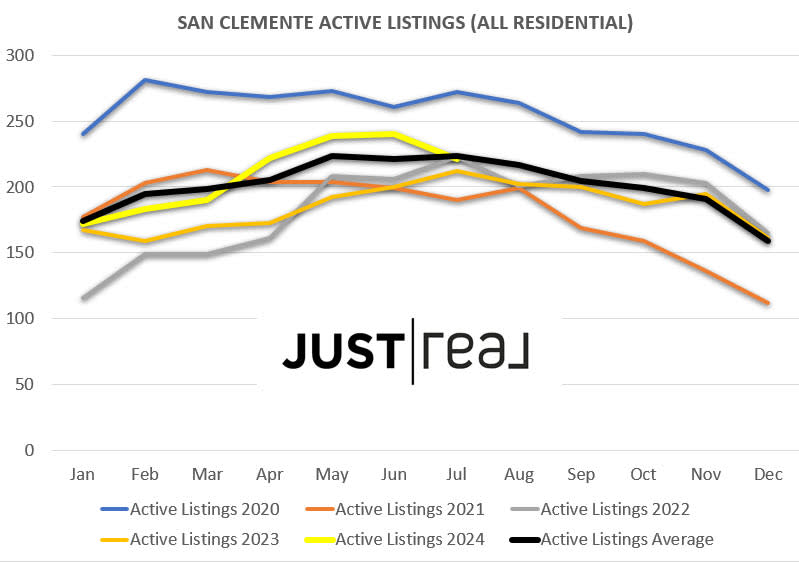
In recent months, there has been a noticeable increase in active listings in San Clemente. However, despite this upward trend, the current number of active listings remains slightly below the typical average for July and is significantly lower compared to the peak levels observed in 2020.
Historically, San Clemente’s real estate market follows a predictable seasonal pattern: active listings tend to peak around July before gradually declining as the market moves into the fall and winter months. This year, 2024, appears to be following this familiar trend. Although the recent surge in listings might give the impression that the market is experiencing unusually high inventory, the data suggests that this year is aligning with the patterns seen in previous years.
The perception of an unusually high number of listings could be influenced by the relative stability of the market in the years following 2020. However, when viewed in the broader context of historical trends, 2024 is shaping up to be consistent with the typical seasonal cycles of the San Clemente real estate market.
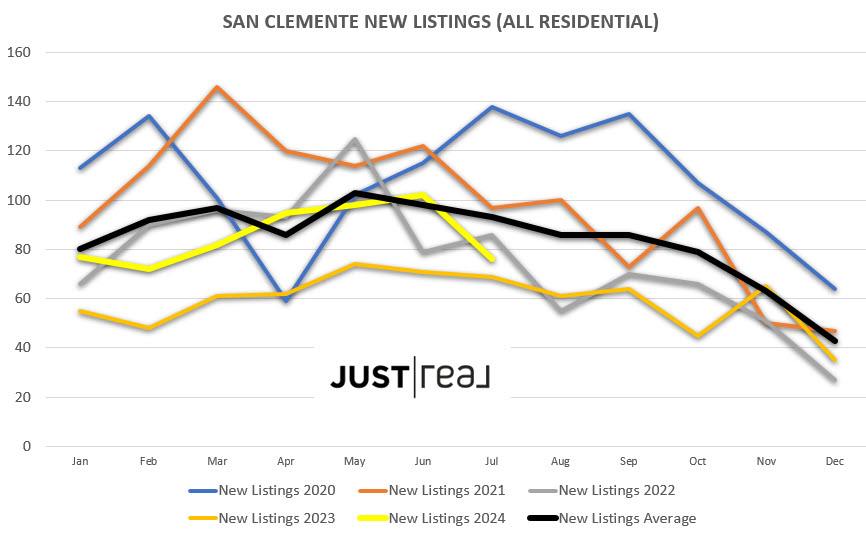
SAN CLEMENTE NEW ACTIVE LISTINGS DECLINE IN JULY OF 2024
In July 2024, San Clemente experienced a noticeable decline in new active listings, following a peak earlier in the month. This drop is further support that the active listings will decline as it typically does into the fall and winter months.
When comparing the current number of new listings to historical data, it's clear that the current amount is below the average for the past four years. Moreover, the 2024 figures are significantly lower than the levels seen in 2020.
This trend indicates a shift in the market, where the typical surge in listings that precedes the slower fall and winter months is not as pronounced this year. For potential buyers and sellers, this could mean a tighter market with fewer options available as the year progresses.
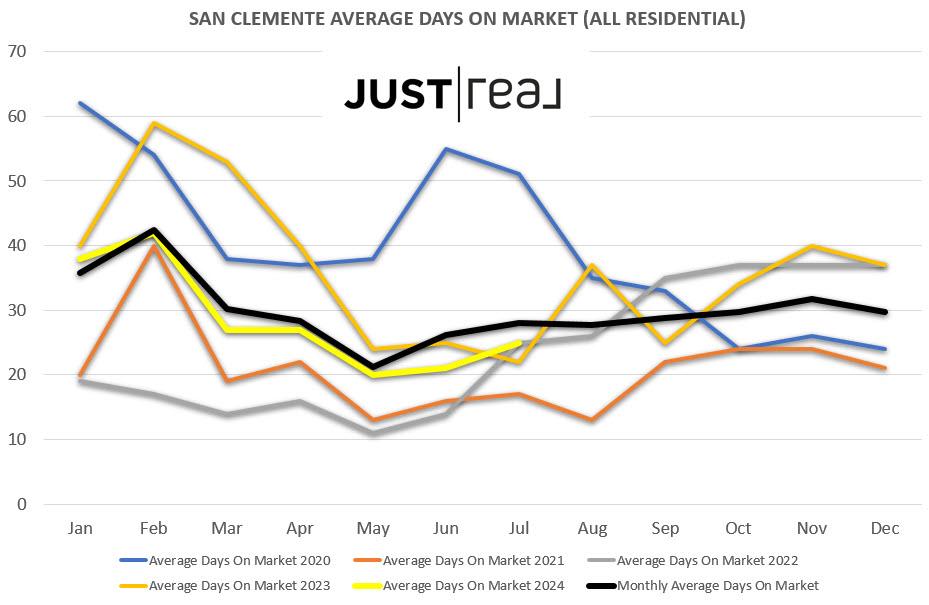
SAN CLEMENTE AVERAGE DAYS ON MARKET PAST 4 YEARS
In 2024, the average days on market for homes in San Clemente has been gradually increasing since its low in May, following the typical seasonal pattern where market times tend to rise as the year progresses into the fall and stabilize during the winter months as inventory once again declines. Despite this recent uptick, the current days on market remains below the four-year average and significantly lower than the levels observed in 2020. This suggests that while homes are beginning to take longer to sell as the year advances, the market remains relatively active and slightly quicker-paced compared to previous years.
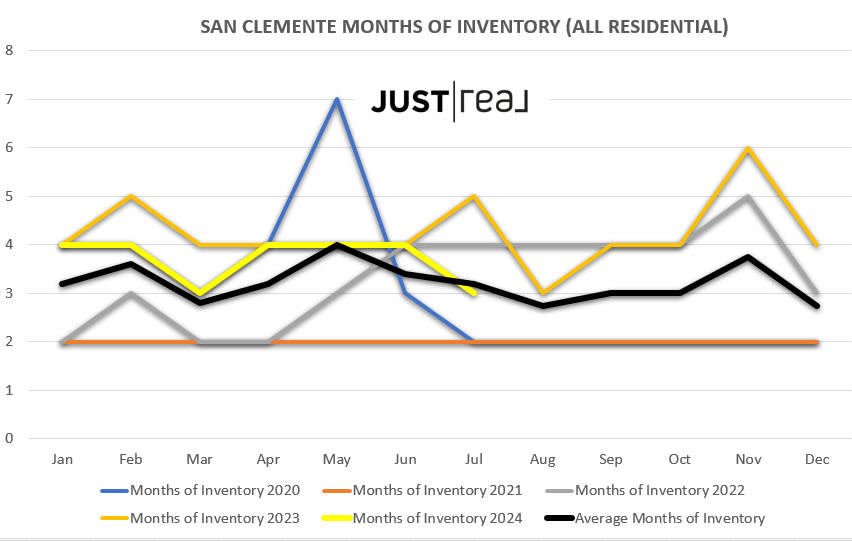
SAN CLEMENTE MONTHS OF INVENTORY PAST 4 YEARS
2024 months of inventory in San Clemente real estate is on track to remain below 4 months which in previous posts I have stated make this market a sellers market. The yellow is the current months of inventory and the black line is the overall average for the past 4 years.
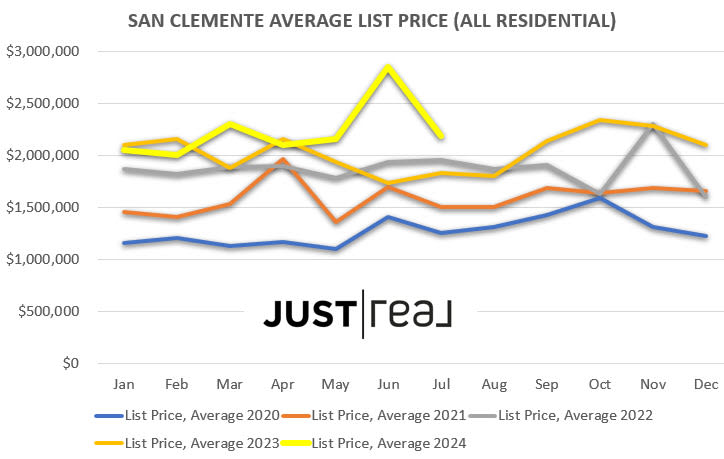
SAN CLEMENTE AVERAGE LIST PRICE PAST 4 YEARS
Over the past 3 months the average list price in San Clemente has fallen drastically. This is due to recently over optimistic sellers having to adjust pricing. The overall trend is intact.
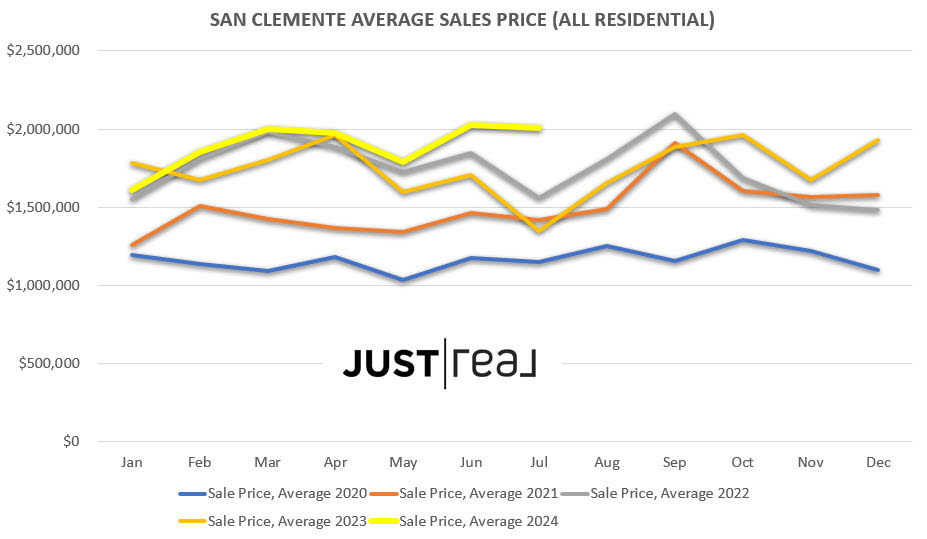
SAN CLEMENTE AVERAGE SALES PRICE PAST 4 YEARS
The market does not go in straight line but the overall trend is higher for prices in San Clemente.
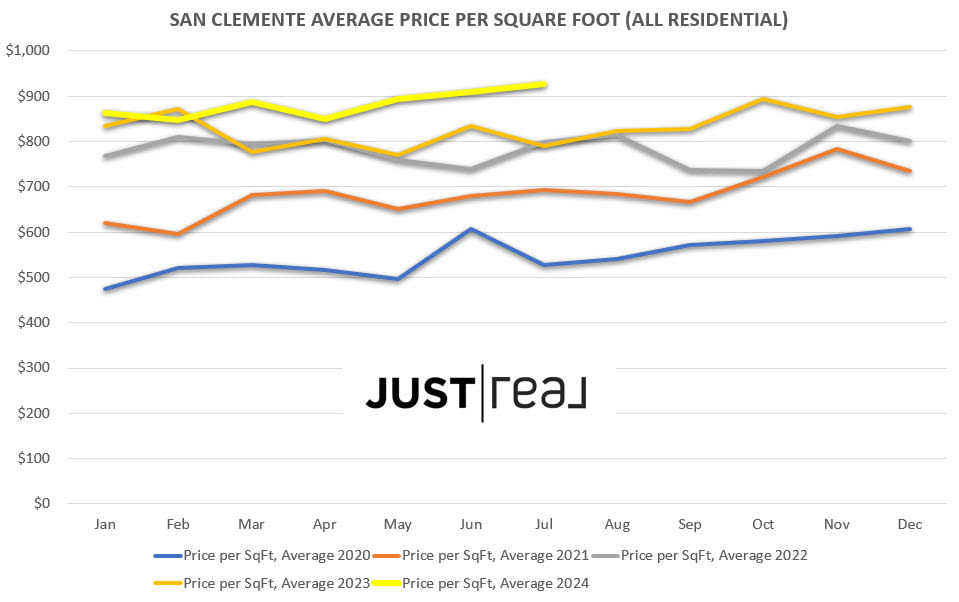
SAN CLEMENTE AVERAGE PRICE PER SQUARE FOOT PAST 4 YEARS
During 2024, the average price per square foot for housing in San Clemente has been on a tear. This is due to lower interest and steady demand for coastal property. The city of San Clemente offers so much and many people outside of the area are noticing. Meanwhile residents that are currently living here are not in a hurry to leave.
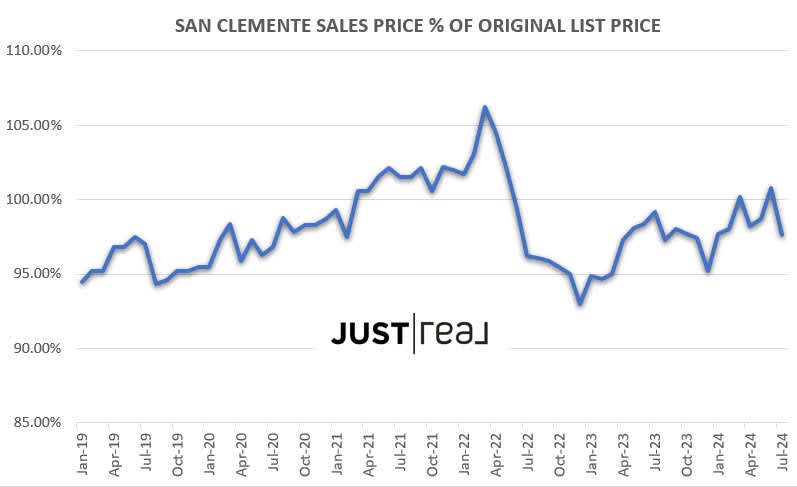
SAN CLEMENTE SALES PRICE % OF ORIGINAL LIST PRICE (ALL RESIDENTIAL)
Higher Percentages: If the 2024 percentage of sales price to list price is higher than in previous years, it suggests a stronger seller's market. This could indicate that buyers are willing to pay closer to or even above the asking price, possibly due to low inventory or high demand.
Lower Percentages: If the percentage is lower, this could indicate a cooling market where buyers have more negotiating power, leading to sales prices below the list prices.
Year-over-Year Changes:
Comparing the percentage change year-over-year can highlight whether the market is becoming more competitive (rising percentages) or less competitive (falling percentages).
Seasonal Trends:
Typically, market activity fluctuates with the seasons, so comparing 2024 data with the same months in previous years can provide insight into whether the current trends are typical or indicate a shift in the market dynamics.
Conclusion: As rates start to come down, we expect an increase in activity in the fall and winter months this year. This goes against what we have seen over the past few years but it is not the first time we will have increased activity into the winter season.